GHG Protocol and ISO 14064‑1
Corporate inventory · scopes 1, 2 and 3
- Location- and market-based electricity
- All 15 scope 3 categories, measured or justified
- Inventory by mine and by plant
Sectors · Mining
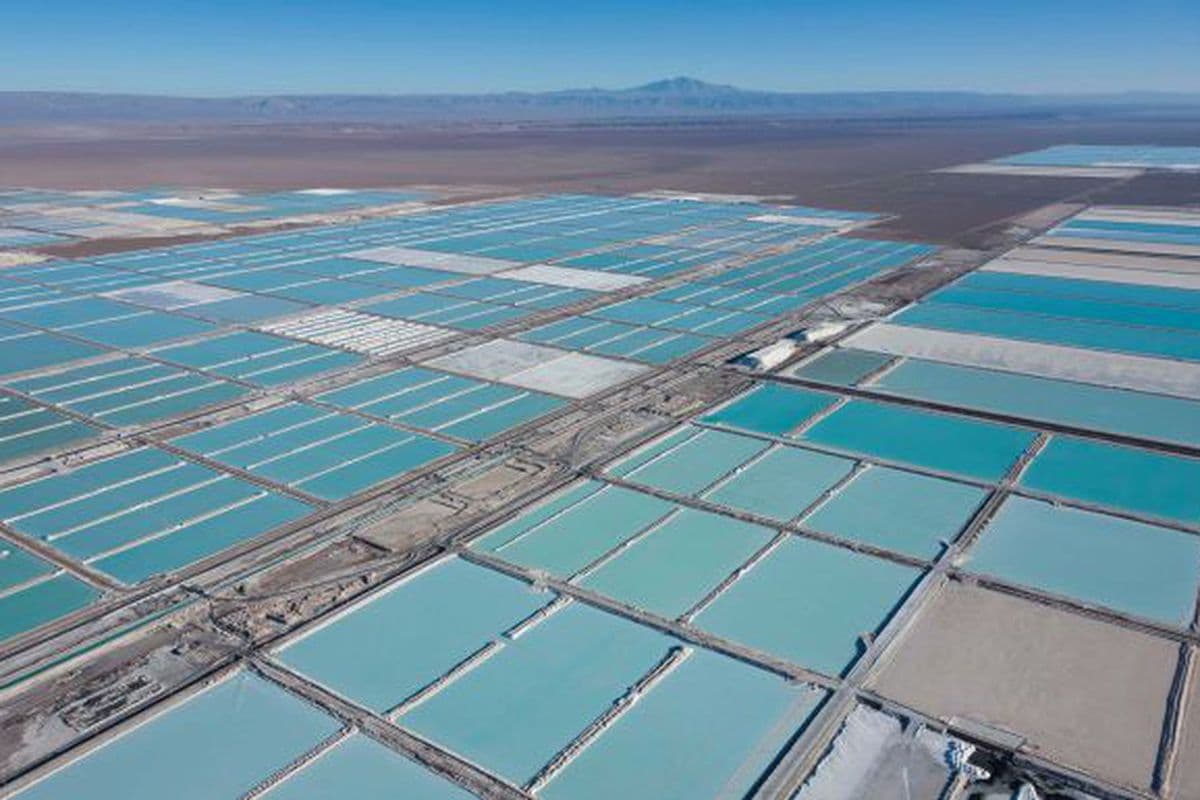
We measure the emissions and water of each operation at the level of detail investors, critical-mineral buyers and communities ask for: the site mapped as a polygon, the fleet and blasting stage by stage, electricity with its contracts, and water by basin, month by month.
Value chain
A mine's footprint isn't a single number: it is the sum of stages with very different sources. So the inventory is built stage by stage, and every source sits in its scope.
Drilling and blasting
Loading and hauling
Processing plant
Tailings and ponds
Transport to port
Use of sold product
Swipe to see every stage
Territory
Every mine, plant and camp goes in with its real boundaries, imported from Google Earth or a GIS. With the polygon, the platform calculates the occupied area and checks satellite imagery for land use change and since when.
It also measures each site's distance to protected areas, Ramsar sites and key biodiversity areas, which is what CDP and the GRI 14 standard ask about.
Water
In mining, water often weighs more than carbon in the conversation with investors and communities. So reporting cubic metres isn't enough: you have to say where and when they are consumed.
Following ISO 14046, each site's consumption is weighted by its basin's scarcity factor for each month. A cubic metre in the dry season of an endorheic basin is not worth the same as one in a wet basin.
Water scarcity footprint
High-altitude endorheic basin
Scarcity factor by month
Water consumption
1.8 hm³/year
Weighted factor
62
Scarcity footprint
112 hm³ eq.
Standards
Corporate inventory · scopes 1, 2 and 3
Water footprint
Sustainability reporting
Benchmark
We compare your targets with those of mining and metals companies in the region that have entered the Science Based Targets process: how many have a validated target, what reduction they commit to, and by when.
How do your targets compare with your sector in the region?
Request my benchmarkAmbition benchmark
Metals and mining · Latin America
Committed reduction by target year (%)
Sector interquartile range
In scope 1, fleet, drilling and generation fuels, and refrigerants. In scope 2, electricity, location- and market-based. In scope 3, reagents and inputs, explosives, capital goods, transport to port and processing of the sold product, among other categories.
Following ISO 14046: water consumed at each site is weighted by its basin's scarcity factor, month by month, because consuming in the dry season is not the same as in the wet season. We also report the regulatory and reputational risk of each basin.
Yes. The same inventory produces the content index for the GRI 14 Mining 2024 standard, with mine sites loaded from your sites, the indicators of the SASB Metals & Mining standard (EM-MM), starting with scope 1 emissions, and drafts of the CDP and IFRS S2 questionnaires.
Yes. The inventory is broken down by site, and the product footprint, for example per tonne of concentrate or lithium carbonate, is calculated under ISO 14067.
We report both figures the GHG Protocol requires: location-based, with the grid factor, and market-based, with each site's contractual instruments and the residual mix for the rest of the consumption.
Bring your site boundaries and consumption data, and in the demo we'll show you the inventory by stage and the water footprint by basin.