GHG Protocol and ISO 14064‑1
Corporate inventory · scopes 1, 2 and 3
- Location- and market-based scope 2
- All 15 scope 3 categories, measured or justified
- Inventory by site and network type
Sectors · Telecommunications
We measure the inventory of network operators and service providers at the level of detail investors and corporate customers ask for: every data centre, exchange and radio base station with its electricity, its generators and its cooling, and the network equipment declared by component.
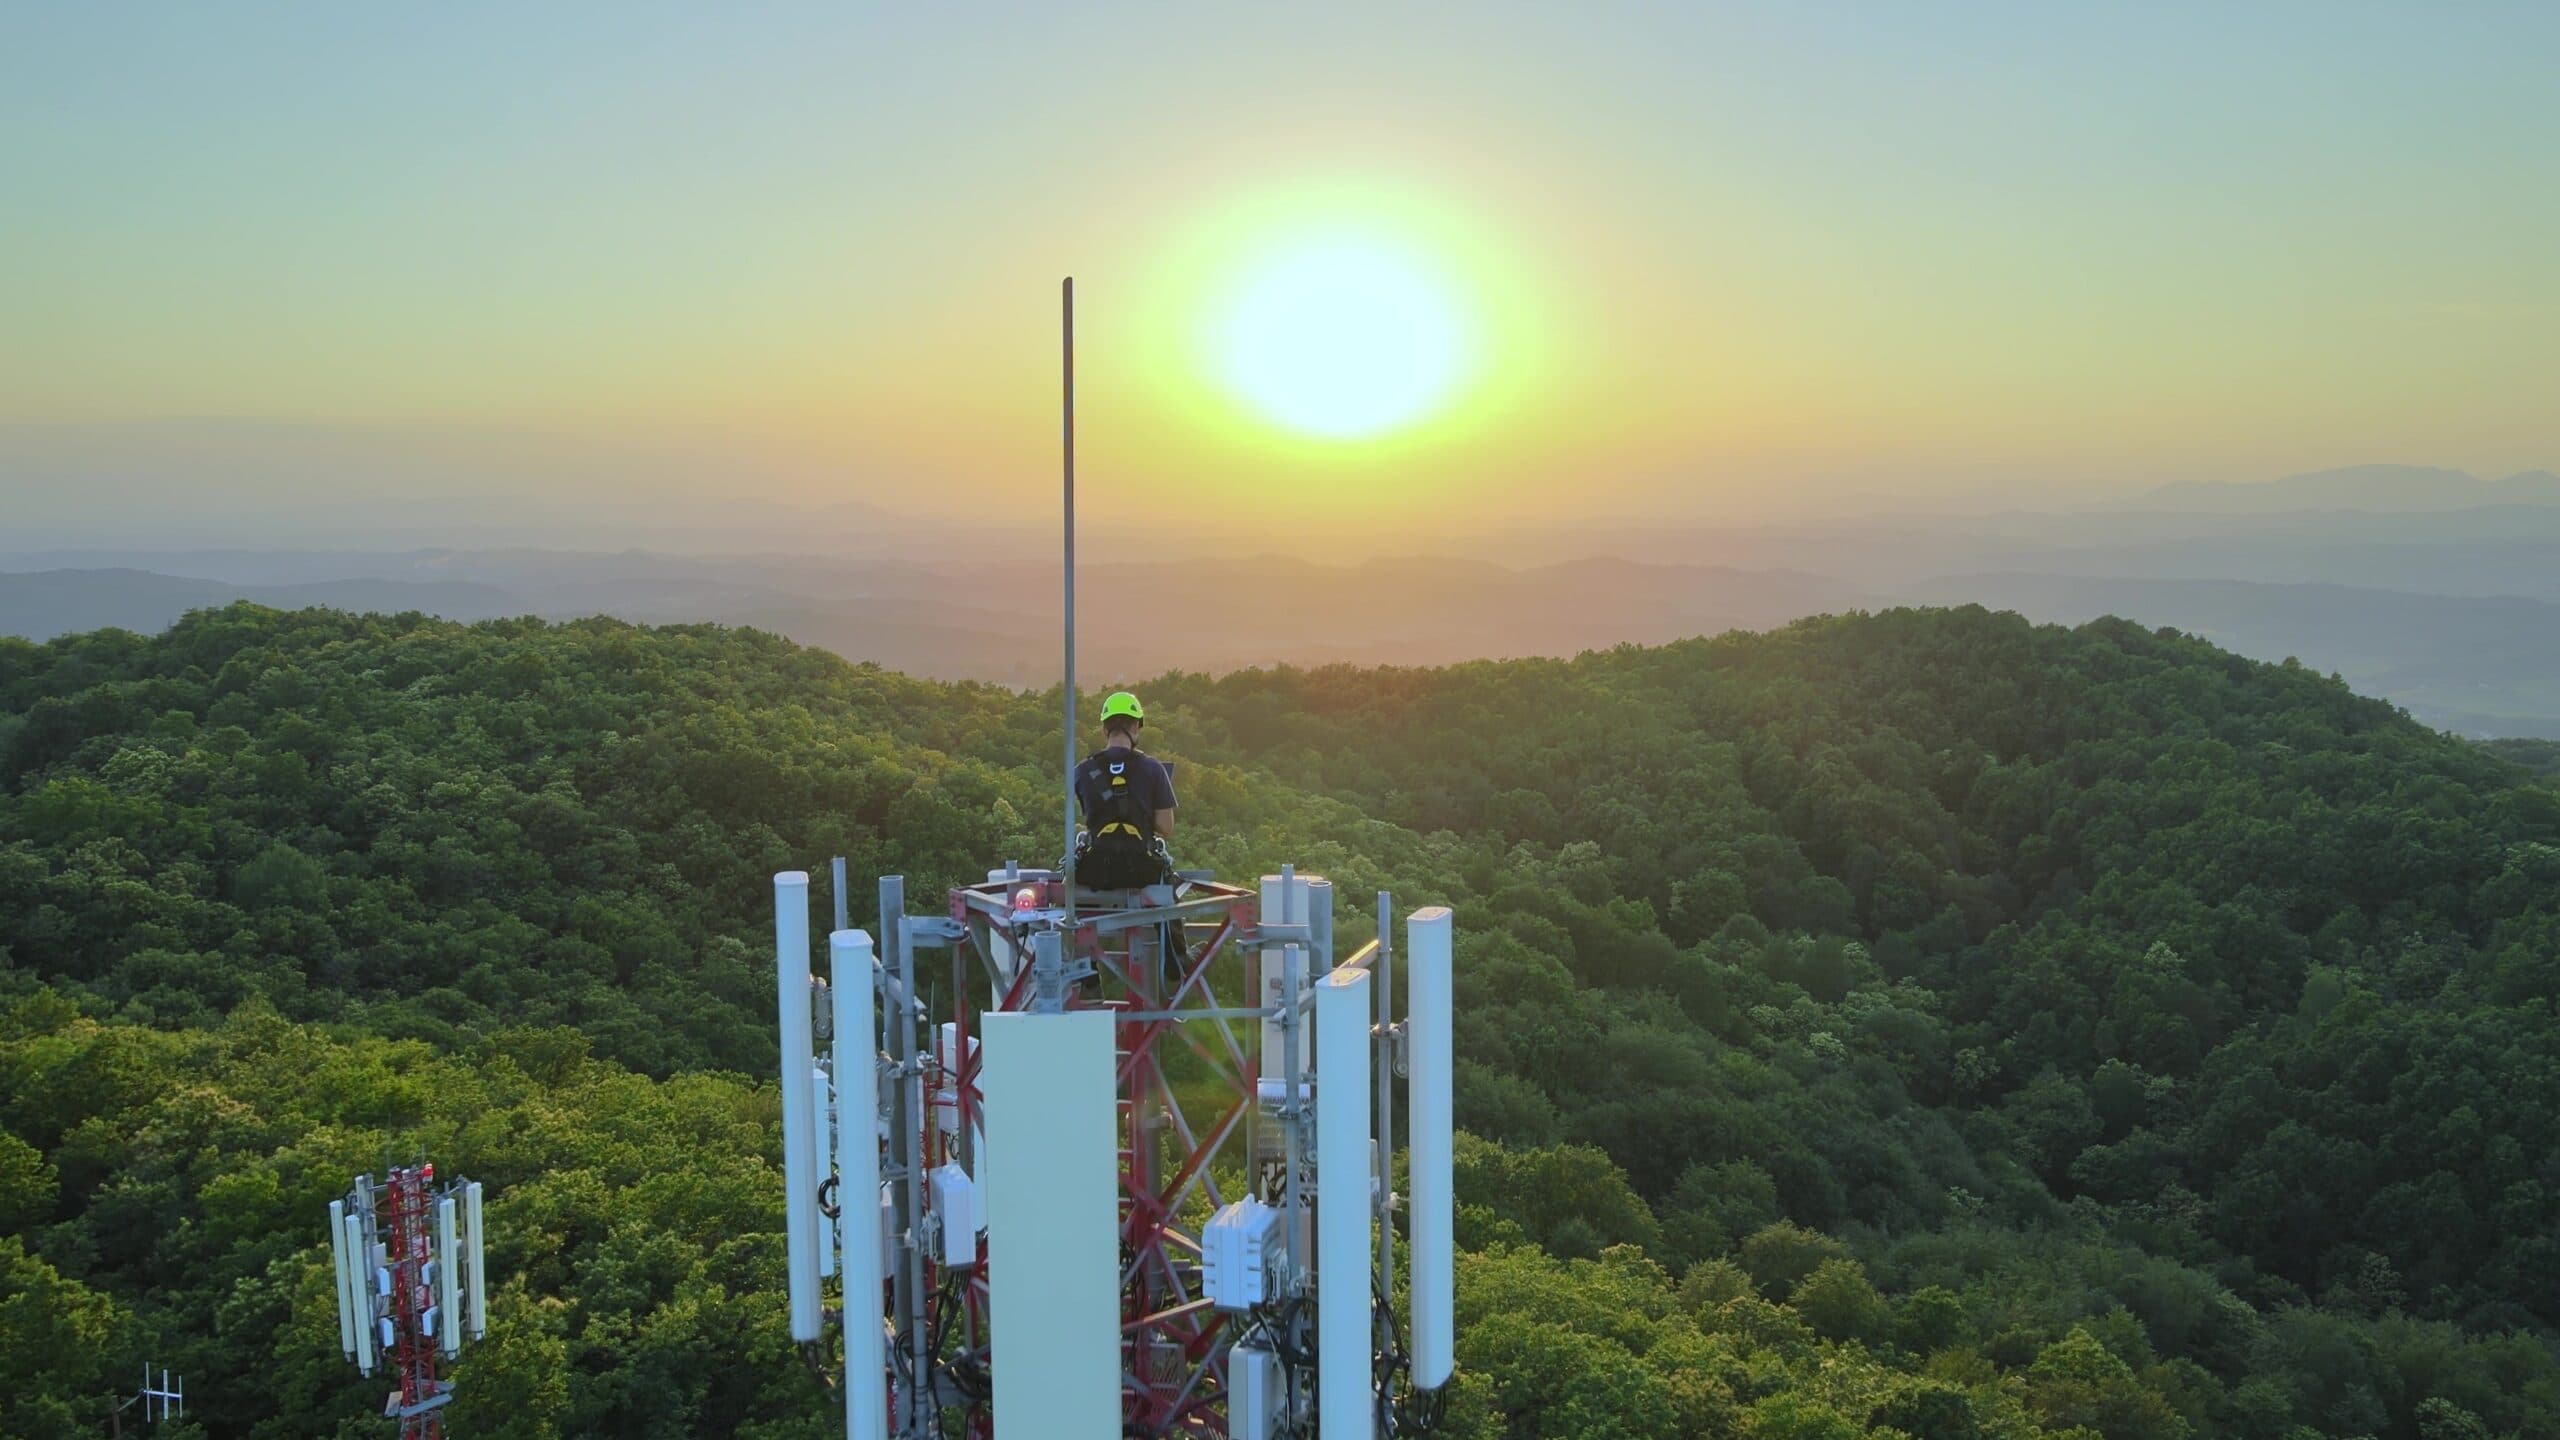
The network
An operator's footprint is spread across thousands of points that use energy around the clock. So the inventory follows the network: from the data centre to the customer's home, with every source in its scope.
Data centres and exchanges
Transport network
Base stations and access network
Technical fleet
Customer equipment
Swipe to see the whole network
Electricity
For an operator, electricity is usually the largest part of the inventory. So how it is reported matters: the GHG Protocol asks for two figures, one with each country's grid factor and another with the renewable energy contracts each site holds.
Consumption not covered by contracts uses the grid's residual mix, not the average. That way the market-based figure isn't inflated with renewable energy another consumer has already claimed.
The rest, with the grid's residual mix
SASB TC-TL-130a.1
Equipment and scope 3
Emission factor databases have almost no data on telecom equipment: there is no factor for a base station or a router. So equipment is declared by component and by weight, which is the figure on the manufacturer's datasheet, as Recommendation ITU-T L.1410 proposes.
The same goes for each site's power backup: lead-acid or lithium batteries, rectifiers, generators and solar panels, each with its own factor.
Standards
Corporate inventory · scopes 1, 2 and 3
Information and communication technology equipment
Sustainability reporting
Benchmark
We compare your targets with those of telecom and technology companies in the region that have entered the Science Based Targets process: how many have a validated target, what reduction they commit to, and by when.
How do your targets compare with your sector in the region?
Request my benchmarkAmbition benchmark
Technology and telecoms · Latin America
Committed reduction by target year (%)
Sector interquartile range
Each data centre, exchange or group of sites goes in as a site, with its electricity use, its generators and its cooling equipment. The inventory is broken down by site and by scope, so you can see where most of the emissions are.
With the two figures the GHG Protocol requires: location-based, with the grid factor, and market-based, with each site's contracts and certificates and the residual mix for the rest of the consumption.
By component and by weight, as Recommendation ITU-T L.1410 proposes: the kilos of electronics in each piece of equipment, the metres of cable, and each site's batteries and rectifiers, each with its own factor.
Yes. Its lifetime electricity use goes into scope 3 category 11, and its end-of-life treatment into category 12.
Yes. The SASB Telecommunication Services standard (TC-TL) is already in the Disclosure module, alongside the CDP and IFRS S2 questionnaires, which are filled in from the same inventory.
Bring your sites' electricity use and in the demo we'll show you the inventory by site, location- and market-based scope 2, and the network equipment.