Land Sector and Removals Standard
GHG Protocol · in force from 2027
- Land emissions in four subcategories
- Removals reported separately, not netted
- Occupied hectares in scope 1 and 3
Sectors · Agribusiness and food
We measure the footprint of farms, packing houses and processing plants at the level of detail that buyers and reduction targets now require: every lot with its polygon, its soil, its land use history and its field operations. So the number in the report holds up hectare by hectare.
Territory
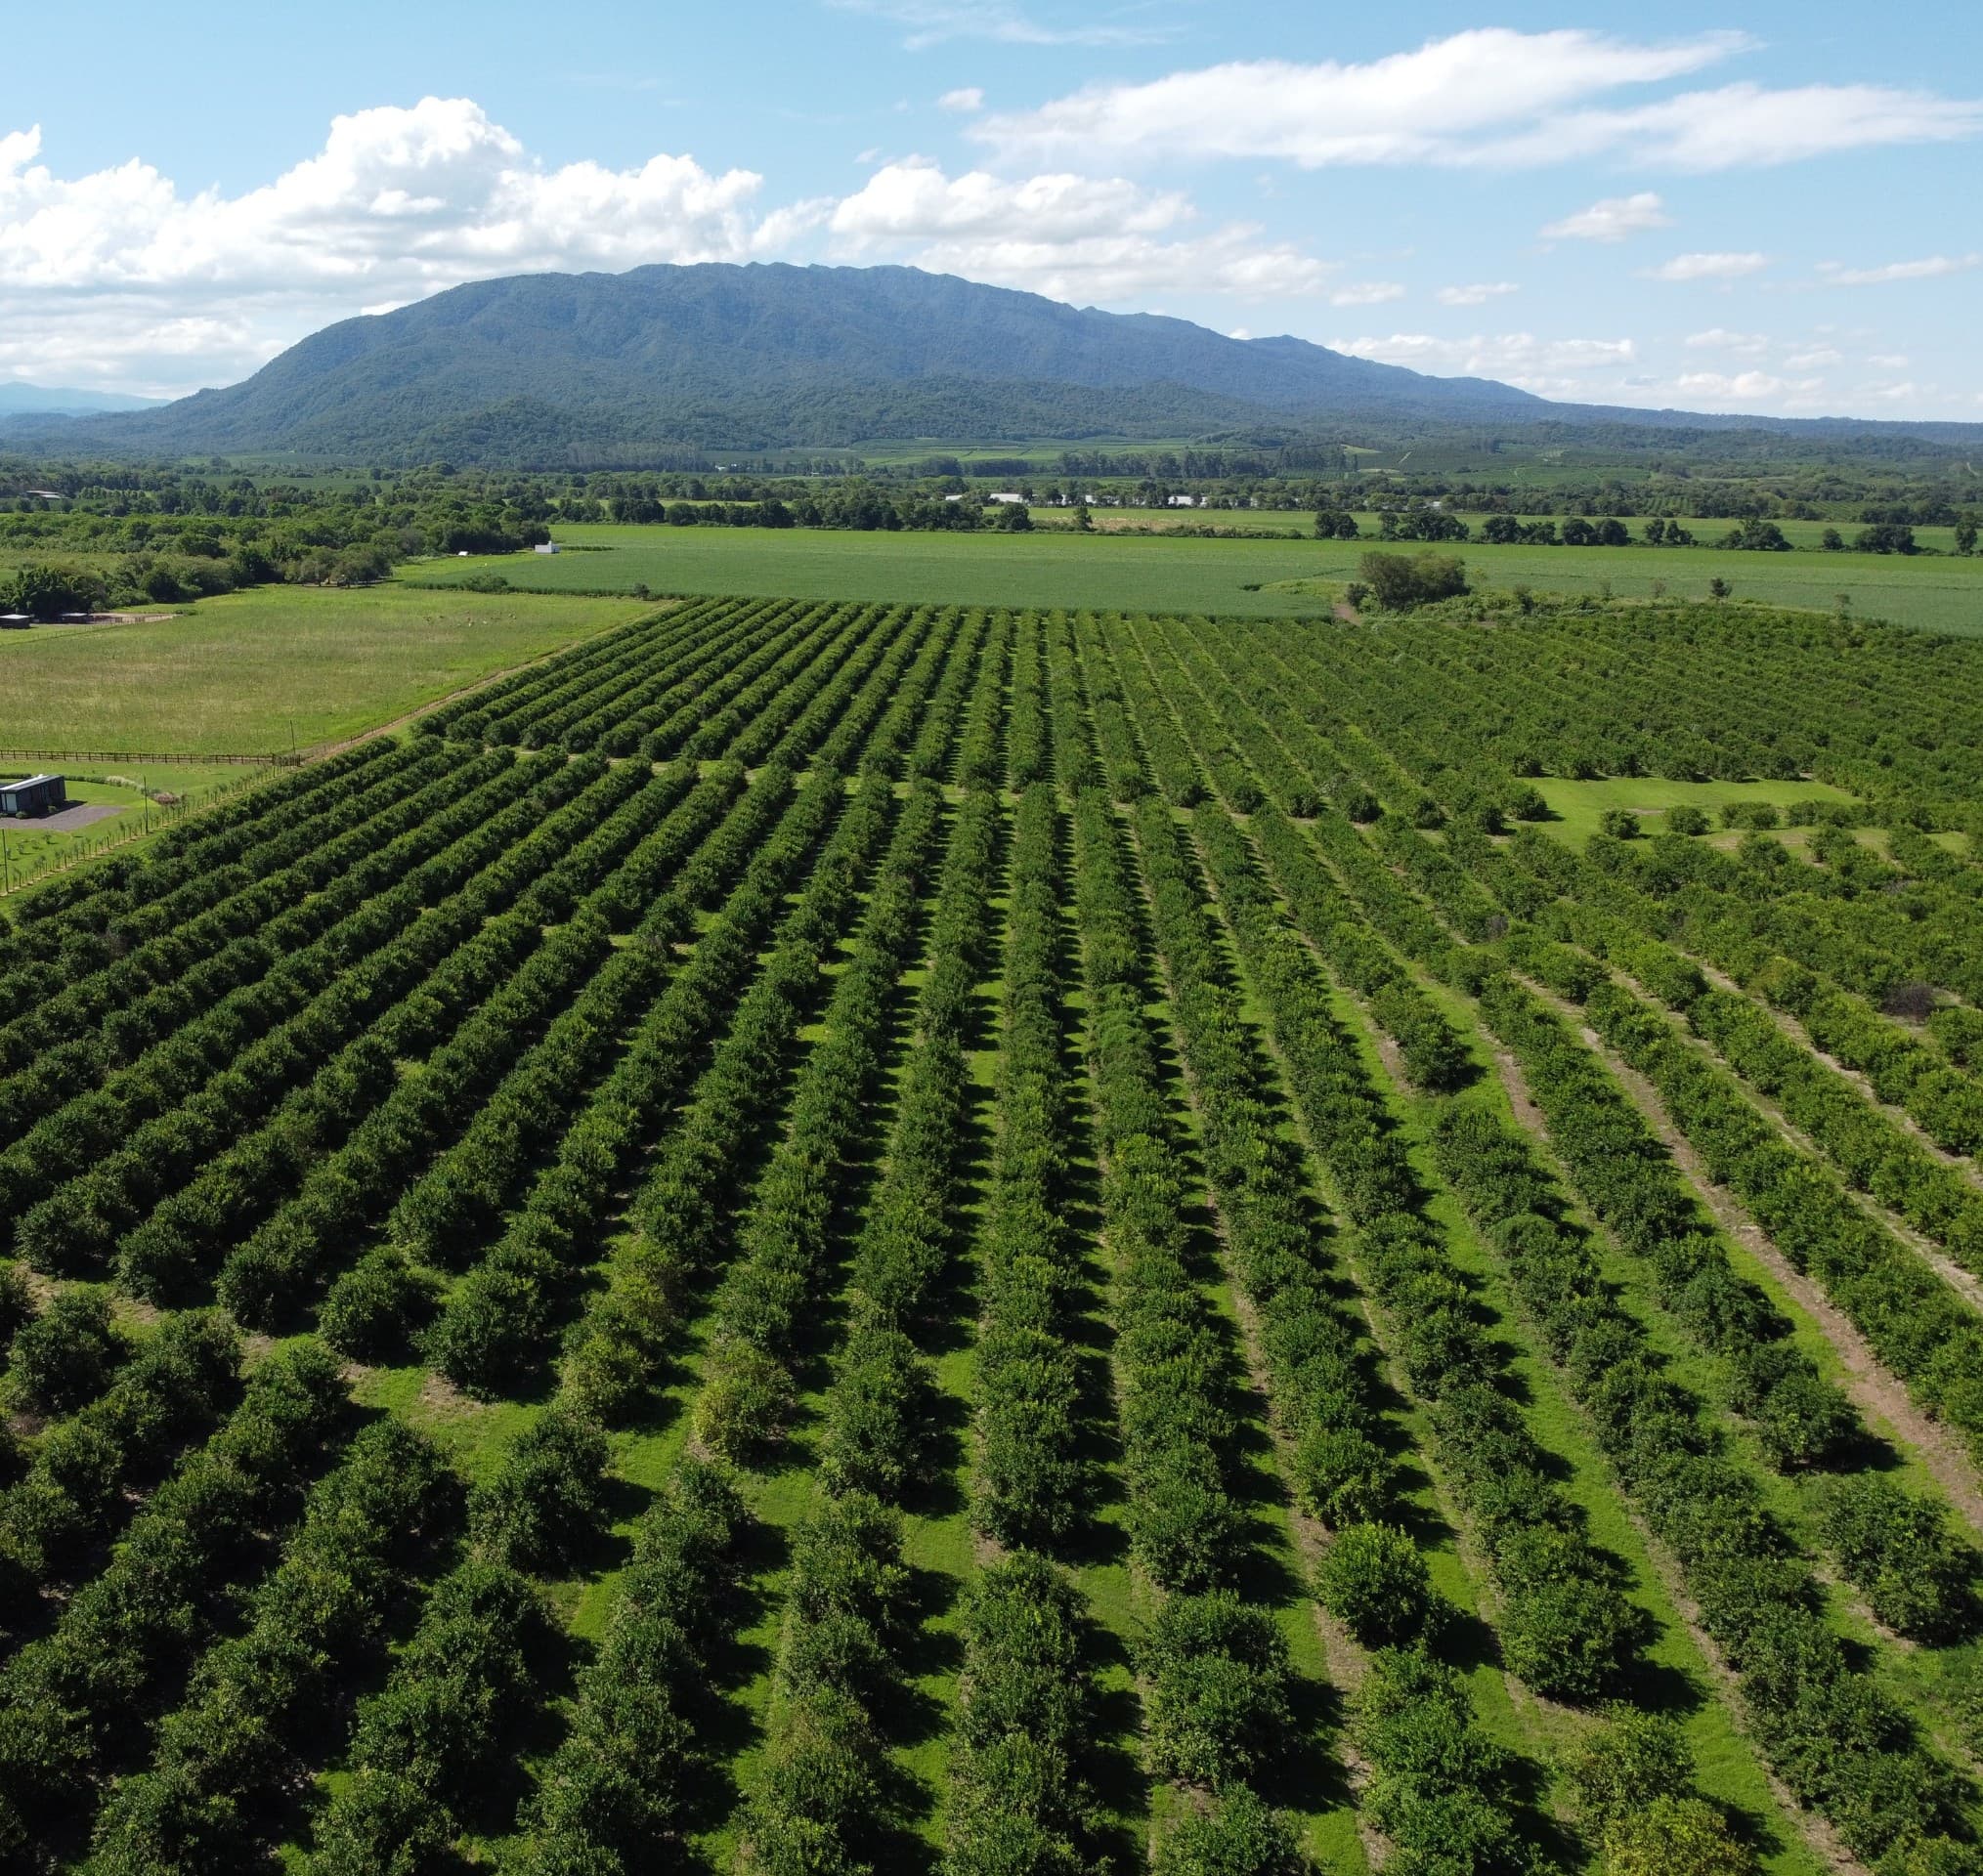
A farm doesn't go in as a pin on a map. It is drawn or imported from Google Earth or a GIS (KMZ, KML or GeoJSON), and each lot becomes a polygon with its area, its crop and its planting year.
Each polygon is overlaid with 250 m digital soil maps and daily weather series. So the footprint doesn't rely on a national average: it uses the soil and climate of the lot.
Lot 4 · Lemon · planted 2009
Land use change
Land use change is often the largest emission source of an agricultural product, and the one buyers ask about most. So it isn't declared from memory: it is checked against satellite imagery.
For each lot we analyse the yearly vegetation index series and tree cover loss since 2001. If there was a conversion, the system proposes the year and the previous use. If there wasn't, it records that as evidence, which is exactly what an auditor asks for.
Soil emissions
On a farm, most field emissions don't come out of an exhaust pipe: they come out of the soil. Every kilo of nitrogen that goes in with a fertiliser, a manure or a crop residue travels this cycle, and part of it returns to the atmosphere as nitrous oxide, a gas 273 times more potent than CO₂. We calculate it with the IPCC 2019 equations, using each lot's soil, climate and irrigation.
Swipe to see the full diagram
Beyond the soil: fuel per field operation, irrigation energy, fertilisers and crop protection per commercial product, residue burning, livestock, and at the packing house and plant, electricity, refrigerants, packaging and effluents.
Result
The report breaks the footprint down by stage and source, and keeps apart what the standard says to keep apart: land use change emissions, removals and land occupation are never mixed with the rest.
With the same lots we calculate the green, blue and grey water footprint under ISO 14046: crop evapotranspiration with the FAO-56 method, irrigation per lot and source, and the water risk of each farm's basin.
See water footprintFresh lemon, at the packing house gate
0.24
kg CO₂e per kg of fruit
Reported separately

Standards
GHG Protocol · in force from 2027
SBTi · agri-food sectors or ≥ 20% land emissions
ISO 14067 · ISO 14064‑1 · ISO 14046
Benchmark
We compare your targets with those of companies in your sector and region that have entered the Science Based Targets process: how many have a validated target, what reduction they commit to, and by when.
It helps set a target the market will read as serious before you submit it, and tells you what your customers will ask when they compare suppliers.
How do your targets compare with your sector in the region?
Request my benchmarkAmbition benchmark
Agricultural production · Latin America
Committed reduction by target year (%)
Sector interquartile range
No. For each lot we use 250 m digital soil maps. If you have laboratory analyses, they are loaded lot by lot and replace the map for that lot.
We analyse each polygon with satellite vegetation index and tree cover loss series since 2001. If there is no event in the assessment window, that is recorded as evidence in the inventory, with the series behind it.
Yes, if it is in one of the SBTi designated sectors, such as agricultural production or food processing, or if its land emissions reach 20% of the total across the three scopes. Below that threshold it is recommended but optional.
From 2027, land emissions are reported in four subcategories, removals are reported separately and not netted, and occupied hectares must be disclosed for scope 1 and 3. The platform already calculates all of this from your lot data.
Yes. For agricultural products and processed foods companies, the same inventory feeds the indicators of the sector's SASB standards (FB-AG and FB-PF), starting with scope 1 emissions.
Yes. Product footprints follow ISO 14067 and the report documents the origin of every data point, the land use history of each lot and the satellite evidence, which is what buyers and certifiers usually ask for.
Bring your lot polygons and in the demo we'll show you the soil, the satellite history and a first footprint.