ISO 14083 and GLEC Framework
Transport chain emissions
- Calculation leg by leg and by mode
- Fuel supply (WTT) and operation (TTW) separate
- Default factors where there is no primary data
Sectors · Logistics and transport
We calculate freight emissions for carriers, logistics providers and companies that ship their production: every leg with its mode, its vehicle and its real distance, under ISO 14083 and the GLEC Framework. So the freight figure can be audited and shared with the customer.
The chain
Freight isn't a number per kilometre. Each leg has its mode, and each mode is measured differently: the real road route by truck, the sea route around continents by ship, and the great circle with an uplift by air.
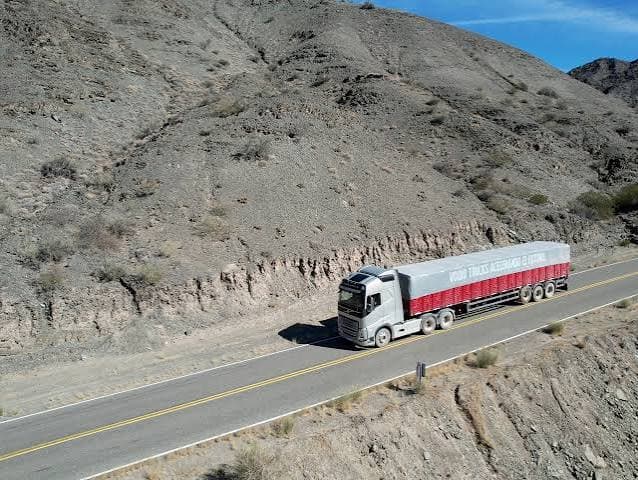
Truck · 40–44 t artic
Ship · container vessel
Truck · 40–44 t artic
Swipe to see the whole route
Scopes
The same trip falls in different scopes depending on who owns the vehicle and who pays. The platform resolves it leg by leg, so freight is neither double-counted nor left out.
Own fleet
Scope 1 + 3 (cat. 3)
The truck's combustion is scope 1; fuel production is scope 3 category 3.
Contracted freight, inbound
Scope 3 (cat. 4)
Transport of inputs and internal movements paid for by the company.
Contracted freight, outbound
Scope 3 (cat. 9)
Distribution of sold products not paid for by the company.
Outbound logistics in a product footprint
Reported separately
Under PACT, reported separately up to the point where the customer takes over the freight.
Factors
A van emits almost ten times more per tonne-kilometre than a heavy articulated truck. So each leg uses the factor for its vehicle class, with the load factor and empty running the GLEC Framework publishes.
If you have the litres of fuel, the calculation starts there. If not, from the leg's tonne-kilometres.
Diesel trucks · Europe and South America
g CO₂e per tonne-kilometre
| Vehicle | WTT | TTW | WTW |
|---|---|---|---|
| Van < 3.5 t | 195 | 647 | 842 |
| Rigid 7.5–12 t | 52 | 172 | 223 |
| Rigid 20–26 t | 32 | 107 | 137 |
| Artic 40–44 t | 21 | 69 | 89 |
| Artic up to 60 t | 16 | 54 | 70 |
Average load: 60% utilisation and 17% empty running. Refrigerated: +12%.
GLEC Framework v3.2 default values
Standards
Transport chain emissions
Corporate inventory
Product footprint
Benchmark
We compare your targets with those of transport and logistics companies in the region that have entered the Science Based Targets process: how many have a validated target, what reduction they commit to, and by when.
How do your targets compare with your sector in the region?
Request my benchmarkAmbition benchmark
Transport and logistics · Latin America
Committed reduction by target year (%)
Sector interquartile range
ISO 14083 sets the method for calculating and reporting the emissions of a transport chain. The GLEC Framework is the practical guidance that applies it and publishes default factors for each mode. They are used together: the standard says how, and GLEC provides the values when you have no data of your own.
Yes. It is calculated from each leg's tonne-kilometres and the factor for its vehicle class. Distance comes from the real road route by truck, the sea route by ship, and the great circle with an uplift by air.
It depends on who pays. Transport of inputs and freight paid for by the company go in category 4; distribution of sold products not paid for by the company, in category 9. If the truck is your own, its combustion is scope 1.
Each leg declares whether the cargo travels refrigerated. Refrigerated legs add the cooling unit's uplift, because it burns its own fuel and a dry truck's factor doesn't include it.
Under PACT, outbound logistics are not part of the product footprint: they are calculated and reported separately, up to the point where the customer takes over the freight. That way the customer can complete the footprint up to their own gate.
Bring your origins, destinations and volumes, and in the demo we'll show you the emissions of each leg and which scope each one falls into.