Livestock
Scope 1
Enteric fermentation and manure from owned dairies and feedlots, with Argentina's national inventory factors by region, category and technology level.
Sectors · Food and beverage
We measure the inventory of meat packers, dairies, wineries, sugar mills and juice makers, and the footprint of every product that leaves their plants: with the raw material from the field, the cold chain, effluents and packaging, and in the format buyers ask for.
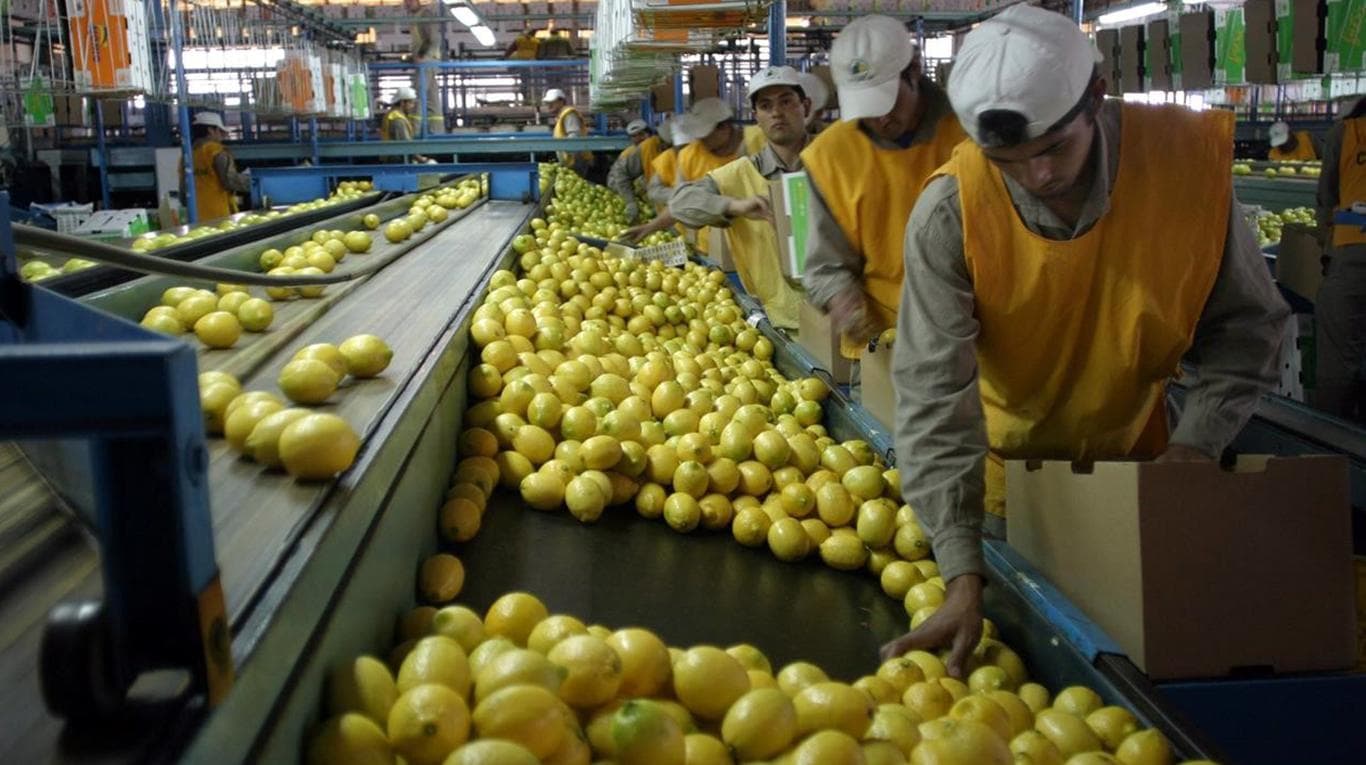
The plant
The inventory takes every input of the plant with its scope and splits the total among the products. The allocation rule changes each product's footprint, so the report states it.
| Product | Tonnes | By mass | Own share |
|---|---|---|---|
| Concentrated juice | 9,000 | 0.28 | 55%0.26 |
| Essential oil | 300 | 0.28 | 25%3.50 |
| Dried peel | 5,700 | 0.28 | 20%0.15 |
kg CO₂e per kg of product
By mass, every product carries the same per kilo. With an own share —for example, by the value of each one— the essential oil carries far more.
Swipe to see the whole diagram
Specific to the sector
Besides the energy and purchases of any plant, a food business has sources of its own. Each one is calculated with its own method and lands in its scope.
Scope 1
Enteric fermentation and manure from owned dairies and feedlots, with Argentina's national inventory factors by region, category and technology level.
Scope 1 · biogenic CO₂ separate
Bagasse and other biomass: methane and nitrous oxide go into scope 1 and biogenic CO₂ is reported separately, as the GHG Protocol requires.
Scope 1 or category 5
Methane and nitrous oxide from meat-packing, dairy and sugar-mill effluents under IPCC 2019, from the organic load and nitrogen.
Scopes 1 and 3
Refrigerant leaks from cold rooms, and refrigerated transport with its own factor on every leg.
ISO 14046
The water footprint of every product, with the water scarcity of the basin where the water is used.
Scope 3
Production and end of life of packaging, with the recycling, landfill and incineration of each destination country.
Sugar and ethanol in northwest Argentina: read the guide on the 15% blend
Suppliers
In food and beverage, most of the footprint usually sits in the raw material coming from the field. With a generic factor, that share doesn't reflect your growers and doesn't improve when they do.
The platform asks each supplier for its data through a link, without them having to create an account, and flags the quality of every number so you know where to ask first.
Purchases 2025
Supplier requests: 14 sent · 9 answered
| Input and data source | kg CO₂e per unit | Quality |
|---|---|---|
| FruitSupplier data, measured | 0.21 / kg | 1 |
| Cardboard boxesManufacturer's verified footprint | 0.79 / kg | 2 |
| Caustic sodaLife cycle database | 1.10 / kg | 3 |
| MaintenanceSpend in dollars | 0.32 / USD | 4 |
Customers
Retailers and brands that buy food and ingredients increasingly ask for the footprint of each product, and they want it in a format their systems can read, not in a PDF.
The platform calculates each product's footprint under ISO 14067 and publishes it with the PACT standard, with the data quality indicators that standard requires.
Concentrated lemon juice
Carbon footprint
0.26 kg CO₂e/kg
Data quality
1 = best · 5 = worst
Standards
Inventory by plant
Product footprint
Land targets
Sustainability reporting
Benchmark
We compare your targets with those of food and beverage companies in the region that have entered the Science Based Targets process: how many have a validated target, what reduction they commit to, and by when.
How do your targets compare with your sector in the region?
Request my benchmarkAmbition benchmark
Food and beverage · Latin America
Committed reduction by target year (%)
Sector interquartile range
When one process yields more than one product, ISO 14067 requires splitting the emissions among them. The platform allocates by mass or with shares the company defines —for example, by each product's economic value—, and the report states the rule used.
For what is bought in kilos or units, a factor from a life cycle database is used; for services, a factor per amount spent. Every number carries its quality level, which shows which suppliers to ask for data first.
It is the WBCSD standard for calculating and exchanging product footprints between companies. It defines a common methodology and an interface so the customer's system reads the supplier's footprint directly. Emetrix is listed in the PACT Network of solutions, supporting Tech Specification version 3.
Yes. If the effluent is treated in the company's own plant, the methane and nitrous oxide it generates are scope 1; if a third party treats it, they go into scope 3 category 5. They are calculated with the IPCC 2019 method, from the effluent's organic load and nitrogen.
Methane and nitrous oxide from combustion go into scope 1. The CO₂ is biogenic: the GHG Protocol requires reporting it separately, outside the scope totals, and the platform shows it apart.
Refrigerant leaks from cold rooms and equipment are scope 1, with each gas's global warming potential. The electricity the cooling uses is already in the site's scope 2, so it isn't counted again.
Bring a year of consumption and each product's output, and in the demo we'll show you the inventory by scope and the footprint of each one.